MCX Nickel Mini Live Price (NICKELM) Today
Here is the latest mcx nickel mini live price analysis and charts.
MCX Nickel Mini Live Price as on 30/05/2019
Last Price | Open | High | Low | Close | Volume |
|---|---|---|---|---|---|
840.5 | 840.2 | 857.3 | 836.1 | 840.5 | 2301500 |
On the MCX, nickel mini futures price change is about 0.1% to Previous Close 838.3. The total volume of shares traded is 2301500
Over the last one week nickel mini price change is about -0.4%. Over the last 30 days, the price change is about --6.33%
MCX Nickel Mini (NICKELM) Live Price Chart
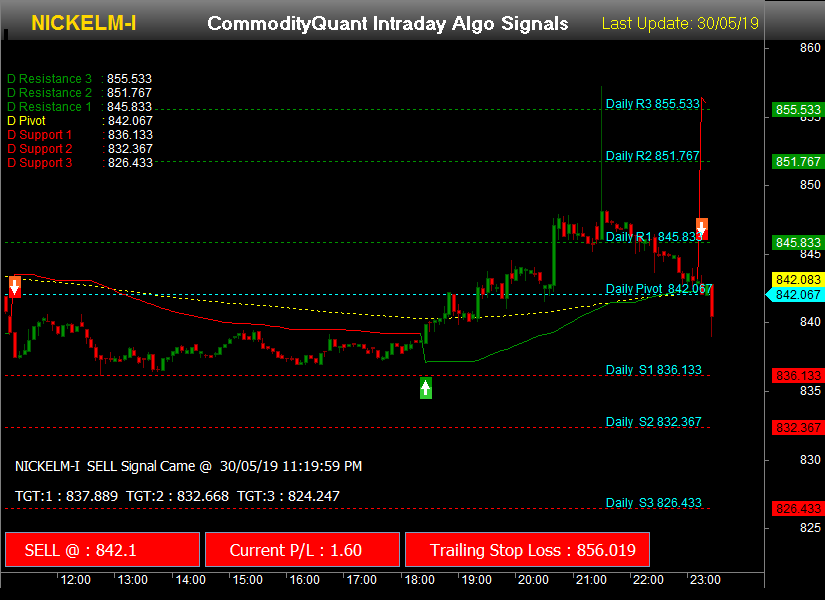
MCX Nickel Mini Trading System 1 :

How to Trade the Nickel Mini Intraday Signals Chart
BUY Trade Entry | Green up arrow & candle stick must trade above the yellow trend line. |
BUY Trade Exit | Trail Stop-loss as per green dotted lines or stop loss price given in text box or when a candle stick crosses below the yellow trend Line |
SELL Trade Entry | Red Down arrow & candle stick must trade below the yellow trend line. |
SELL Trade Exit | Trail Stop-loss as per red dotted lines or stop loss price given in text box or when a candle stick crosses above the yellow trend Line |
We also expect the commodity nickel mini futures to react on the above support and resistance levels for today.
*The below MCX Nickel Mini Live Price Charts are updated every 10 mins with auto refresh.
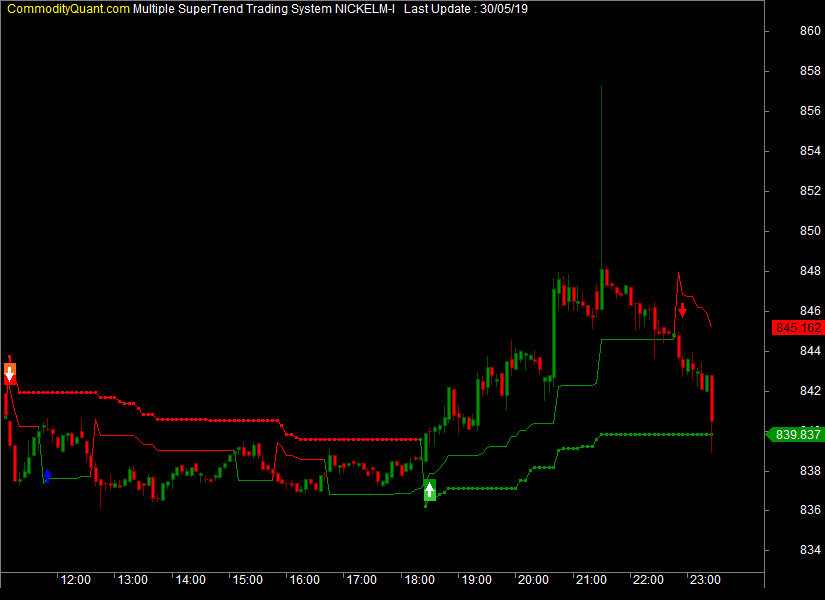
NICKELM Trading System 2 :

How to Trade the NICKELM Multiple Super Trend Chart
BUY Trade Entry | When both super trend indicators are in uptrend. In other words two green stop loss lines below the candlestick. |
BUY Trade Exit | When either of the super trend goes in downtrend. |
SELL Trade Entry | When both super trend indicators are in downtrend. In other words two red stop loss lines above the candlestick |
SELL Trade Exit | When either of the super trend goes in uptrend. |
We have further improved the famous super trend strategy by using two different super trend indicators for generating trade call signals. The strategy increase profits by almost 70% by using two super trend indicators and also helps in exiting fast from the market when the trend is not intact.
MCX Nickel Mini Price Technical Analysis
Quant's Today Trend score for MCX Nickel Mini is MEDIUM DOWN TREND
* A trend score of greater than 5 signals that the commodity is bullish for the day while trend score of less than 2 signals bearish trend*
Indicator | Value | Signal |
|---|---|---|
RSI | RSI is 44.2 | Neutral |
MACD | MACD : -8.7 Signal Line : -8.74 | Bullish |
Stochastic | %D is 52.9 %K is 34.85 | Bearish |
MFI | 34.85 | Neutral |
Aroon | 1 | Bullish |
Bollinger Band | BBTop is 862.41 BBBot is 824.23 | Neutral |
Simple Moving Average Short Term | SMA(15) is 844.67 | Bearish |
Simple Moving Average Mid Term | SMA(45) 868.9 | Bearish |
Simple Moving Average Long Term | SMA(100) {EMPTY} | N/A |
MCX Nickel Mini Interactive Real Time 5 Mins Intraday Chart
Contract Specifications of Nickel Mini
Symbol | NICKELM |
Description | NICKELMMMYY |
Contract Listing | Contracts are available as per the Contract Launch Calendar |
Contract Start Day | 1 st day of contract launch month. If 1st day is a holiday then the following working day |
Last Trading Day | Last calendar day of the contract expiry month. |
Price Quote | Per kilogram |
Lot size | 100 kg |
Tick Size | 10 paise per kg |
Profit/Loss made for every ₹ 1 change | Rs. 100 |
Trading Period | Monday to Friday |
Trading Timings | 10.00 a.m. to 11.30/ 11.55 p.m |
Commodity Group | Base Metals |
Instrument Type | COMMODITY FUTURES |
Initial Margin | Minimum 4% or based on SPAN whichever is higher. |
Contract Launch Calendar
Contract Launch Months | Contract Expiry Months |
|---|---|
September 2017 | January 2018 |
October 2017 | February 2018 |
November 2017 | March 2018 |
December 2017 | April 2018 |
January 2018 | May 2018 |
February 2018 | June 2018 |
March 2018 | July 2018 |
April 2018 | August 2018 |
May 2018 | September 2018 |
June 2018 | October 2018 |
July 2018 | November 2018 |
August 2018 | December 2018 |
* Contract Launch Calendar Source MCXINDIA https://www.mcxindia.com/home
MCX Nickel Mini Price History - NICKELM
Date | Price | Open | High | Low | Volume |
|---|---|---|---|---|---|
29/05/2019 | 838.3 | 844.7 | 848 | 838.3 | 1990300 |
28/05/2019 | 845.1 | 864.6 | 864.6 | 838.4 | 3064700 |
27/05/2019 | 872 | 860.2 | 872 | 872 | 1591600 |
24/05/2019 | 858.6 | 830.5 | 867.5 | 830.5 | 4901500 |
23/05/2019 | 830.5 | 835.8 | 835.8 | 825.7 | 1799800 |
22/05/2019 | 835.4 | 840 | 840 | 835.4 | 2284900 |
21/05/2019 | 843.9 | 838.8 | 848.2 | 833 | 2708400 |
20/05/2019 | 838.2 | 843 | 843 | 827.7 | 2255300 |
17/05/2019 | 854.1 | 856 | 845 | 845.5 | 2587500 |
16/05/2019 | 851.9 | 854.9 | 854.9 | 851.9 | 2736300 |
Get MCX Live Price of the major commodities listed on the multi-commodity change of India. Technical Live Price analysis & price charts of the commodity MCX Nickel Mini is researched every day and updated daily.
